Occy Analytics offers advanced features that enable you to monitor and analyse key performance indicators (KPIs) in your recruitment processes. Offering convenient access to essential metrics, an overview of recruitment performance, job-related data, campaign statistics, candidate information, and diversity, equity, and inclusion (DE&I) reports, recruiters can utilise data-driven insights to enhance their hiring outcomes.
This article will guide you through each area of analytics, how to reset your filters, and how to download and schedule reports.
Browse each section or find details on a specific section here:
- The Overview Section - Click here for key recruitment insights such as total applications, time-to-hire, etc.
- Pipeline Insights - Click here for insights into the candidate journey, application data, rejection analysis, etc.
- Time Metrics - Click here for insights into time-to-hire, time spent in each hiring stage, candidate timelines, etc.
- Hiring Outcomes - Click here for cost distributions and breakdowns, role acceptance rates, etc.
- Operational Data - Click here for data on open positions, filled positions, job trends, etc.
- Sources & Channels - Click here for channel performance comparisons, applications by source breakdowns, etc.
- Datasets - Click here for DE&I reporting and aggregated job data.
- Scheduling Reports - Click here to learn how to schedule custom reports.

The Analytics Section
Access the Analytics section from the main menu.
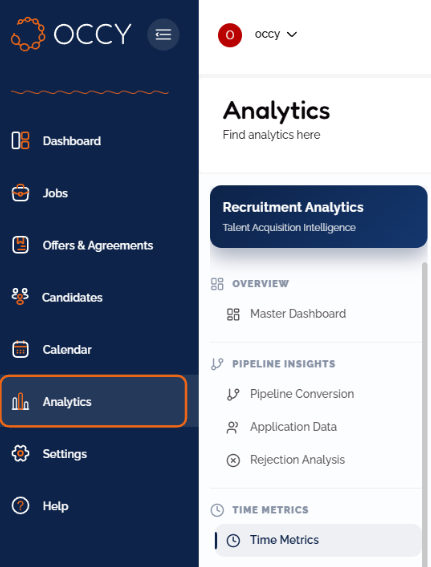
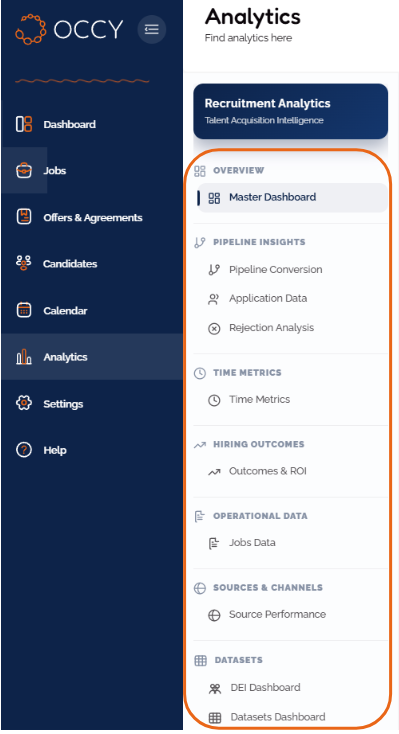
Use the menu on the left-hand side to navigate through the Analytics section. Data is broken down into categories, making it easy for you to find the insights you need.
Refine the data on each page using the range of filters at the top of the section, including date range, department, job level, and location. You can even choose whether to include or exclude data from subsidiary (child) companies using the More Filters dropdown menu.
Simply choose from the options in the dropdown menus and click Apply.
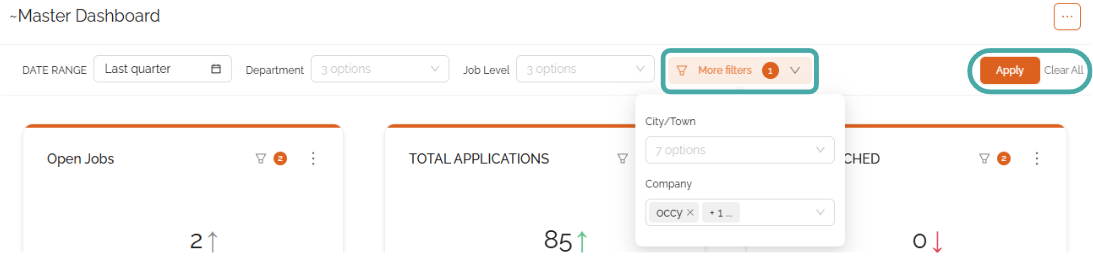

The Overview Section
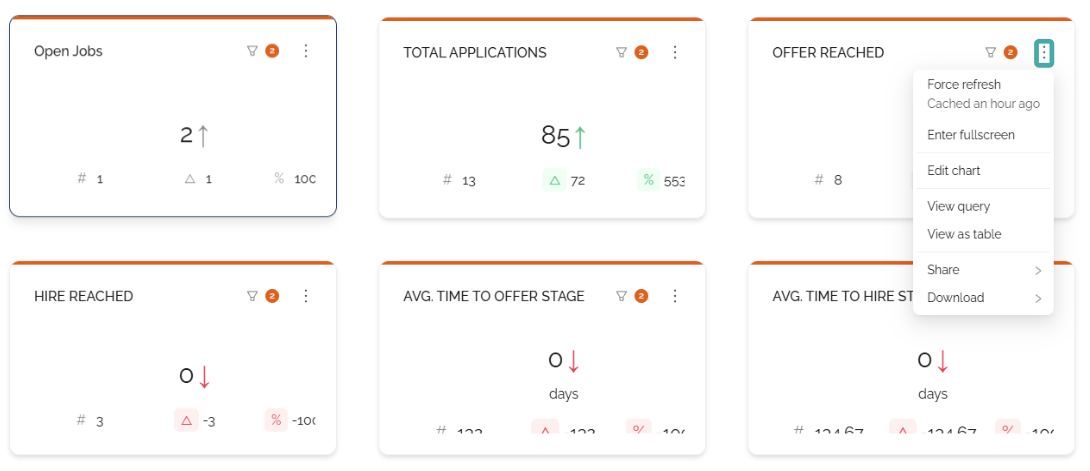
The Analytics section opens onto the Master Dashboard, which provides an overview of all key recruitment insights at a glance.
Use the three-dot menus in each tile to refresh, share, download, and edit the view of the data.
Scroll down to find graphs and charts on other overview information, including:
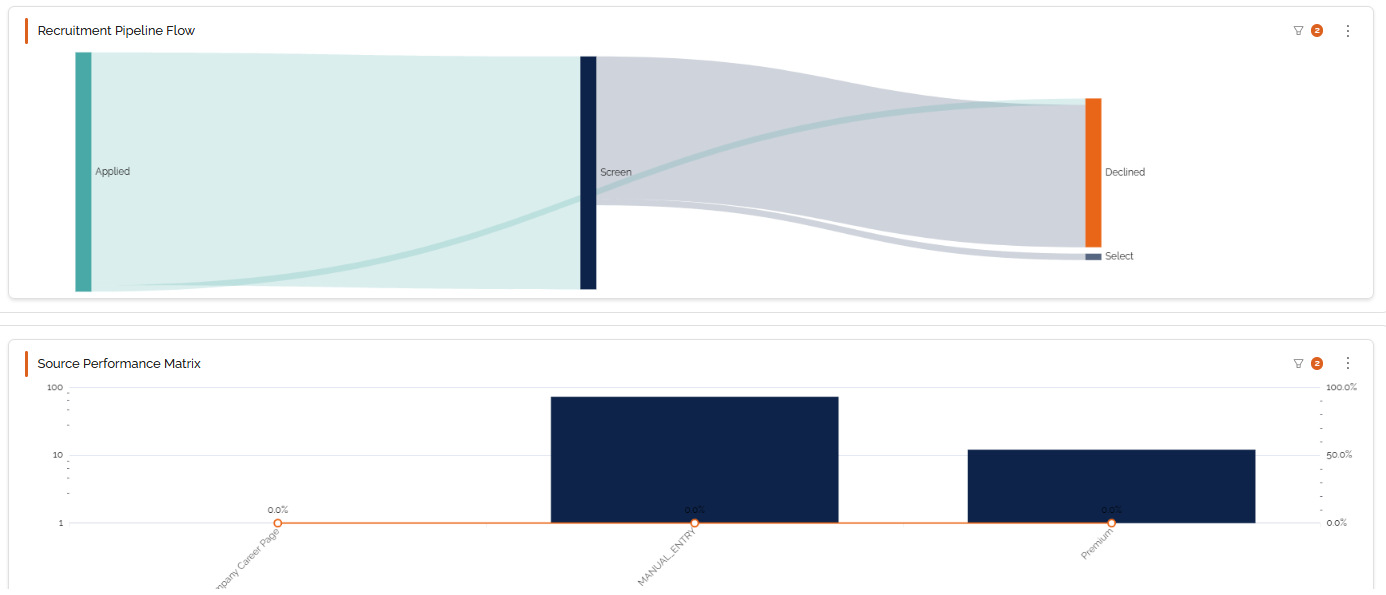
- Recruitment Pipeline Flow - A visual representation of candidate numbers as they move through the hiring workflow.
- Source Performance Matrix - A performance comparison of candidate sources (such as job boards).
- Cost Distribution by Department - Recruitment spend organised by department.
- Applications Trend - A comparison of applications per month.
- Rejections Hotspots by Stage - A visual of candidate rejections by hiring workflow stage (applied, shortlisted, etc.).
- Time Efficiency by Department - A time-to-hire comparison by department.

Pipeline Insights
The Pipeline Insights tab contains three subsections that track data for your hiring pipeline, applications, and rejection analysis.
Pipeline Conversion
The pipeline conversion tab focuses on the candidate journey, tracking candidate numbers at each stage of the workflow to give you a full picture of the candidate journey.
Overview data tiles at the top of the page show the overall conversion rate, total applicants, and total hired candidates.
The graphs and tables cover the following areas:
- Pipeline Flow Application to Hire - A visual representation of candidate numbers as they move through the hiring workflow.
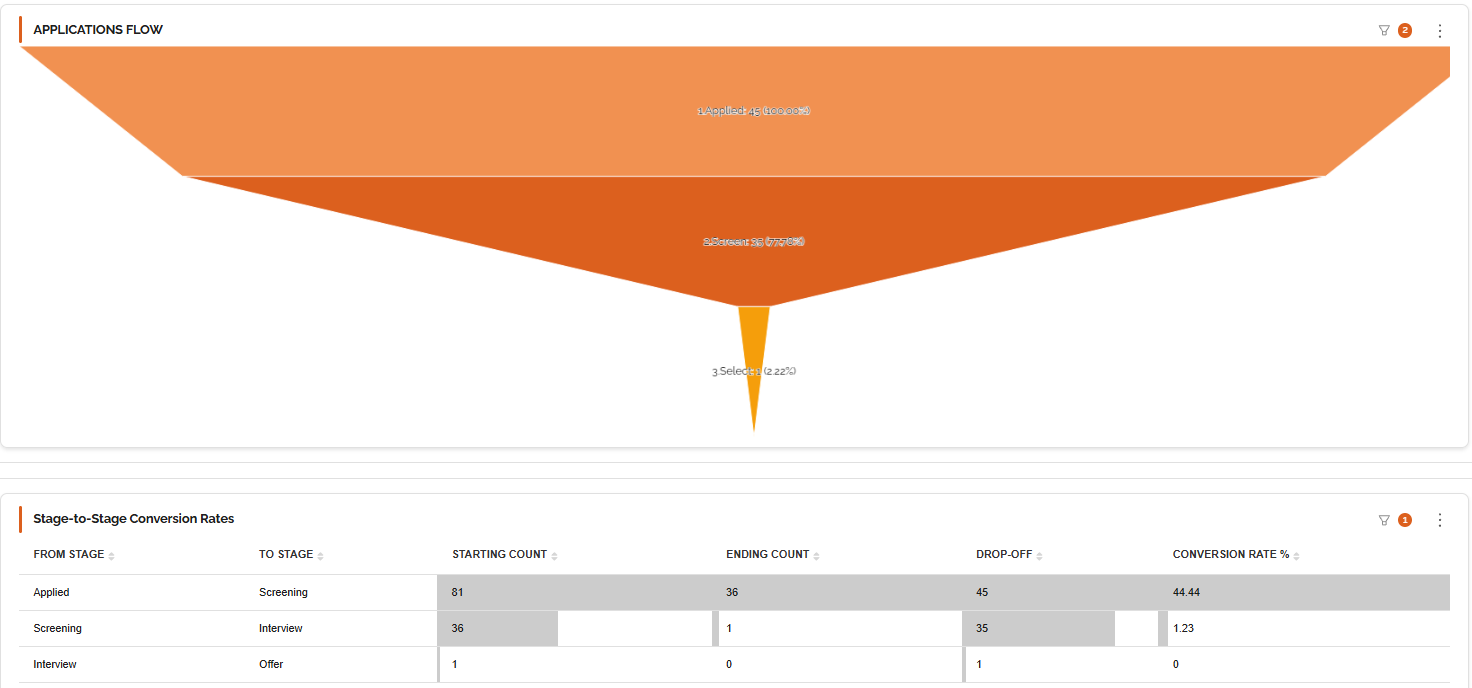
- Applications Flow - A funnel diagram (see below) representing the number of applications in each stage.
- Stage-to-Stage Conversion Rates - Calculates the conversion rate of candidates progressing to the next stage.
- Current Candidates by Stage - Lists the number of candidates currently in each stage of the hiring workflow.
- Candidate Details by Stage - Lists the name, application ID, job, stage, and time spent in the current stage for each candidate.
Application Data
This section tracks all-things-applications. Overview tiles show total applications, application-to-screening rate, and total candidates hired.
View and download charts and graphs showing:
- Applications Over Time
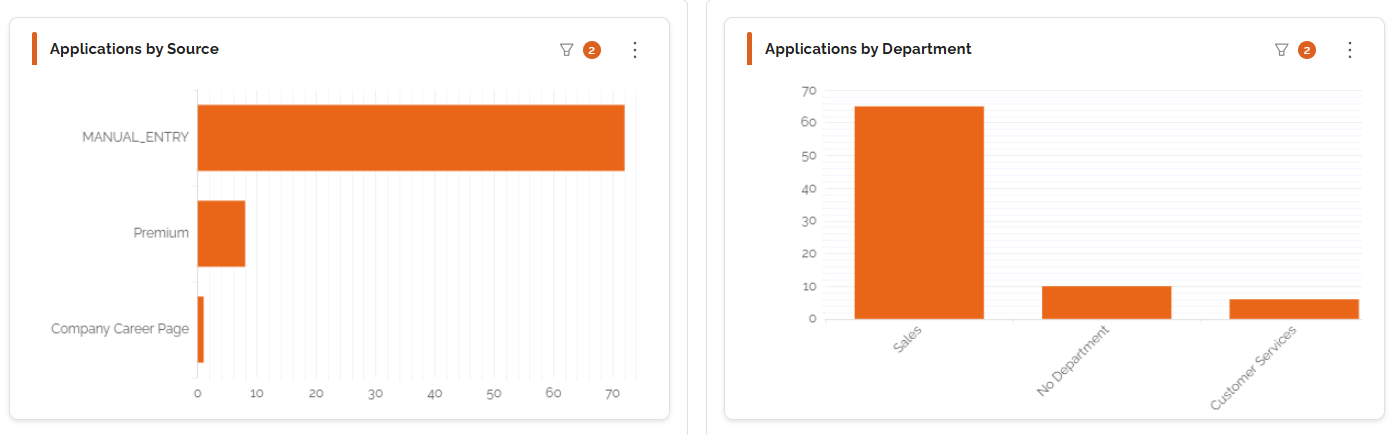
- Applications by Source
- Applications by Department
- Candidate Details
Rejection Analysis
Track when and why candidates are rejected to get a better insight into the candidates that you're attracting in the Rejection Analysis section. Overview tiles show the company rejection rate and the total number of rejections. You'll also find charts and tables breaking down the following:
- Rejections by Reason
- Rejections by Stage & Reason
- Rejection Rate Trend Over Time
- Department Rejections Breakdown
- Rejection Details
- Most Common Rejection Stage
- Candidate Withdrawal Rate


Time Metrics
The Time Metrics tab breaks down how long your hiring process takes, from overall metrics like time to hire to the time candidates spend in each stage.
Overview tiles at the top of the page show average time to hire, average time to offer, median time to hire, median time to offer, and average total pipeline time.
You'll also find the following graphs and charts that you can view, edit, share, and download. Hover over the graphics to see a more detailed numerical breakdown.
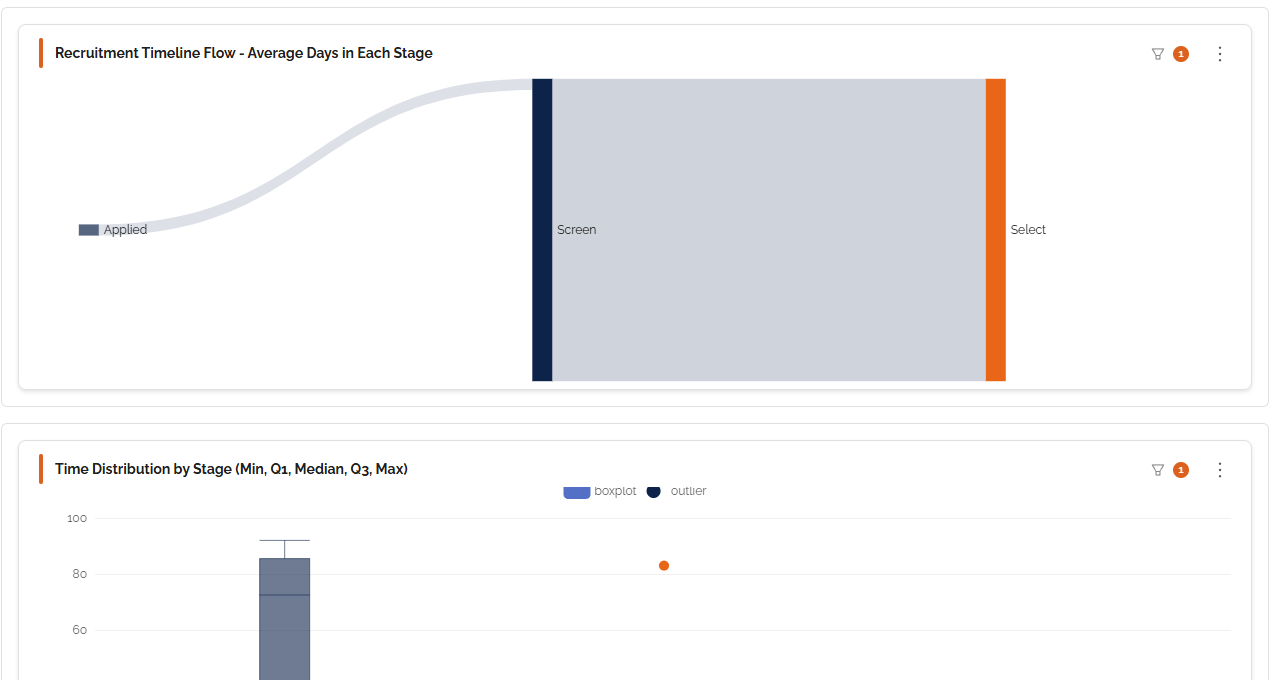
- Recruitment Timeline Flow - Average days in each stage
- Time Distribution by Stage
- Time to Offer vs Time to Hire trend
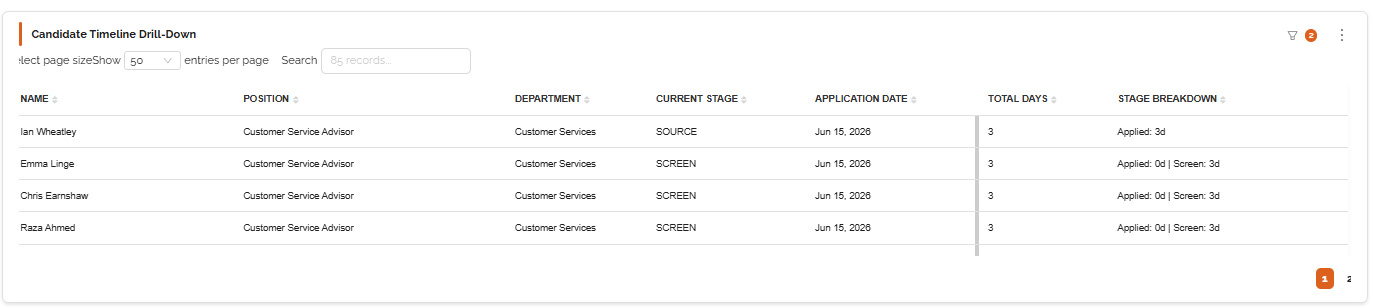
- Candidate Timeline Drilldown

Hiring Outcomes
Monitor your ROI in the Hiring Outcomes tab. Overview tiles show the offer acceptance rate, total hires reached, average cost per hire stage, and total offers reached.
You'll also find further breakdowns of the following:
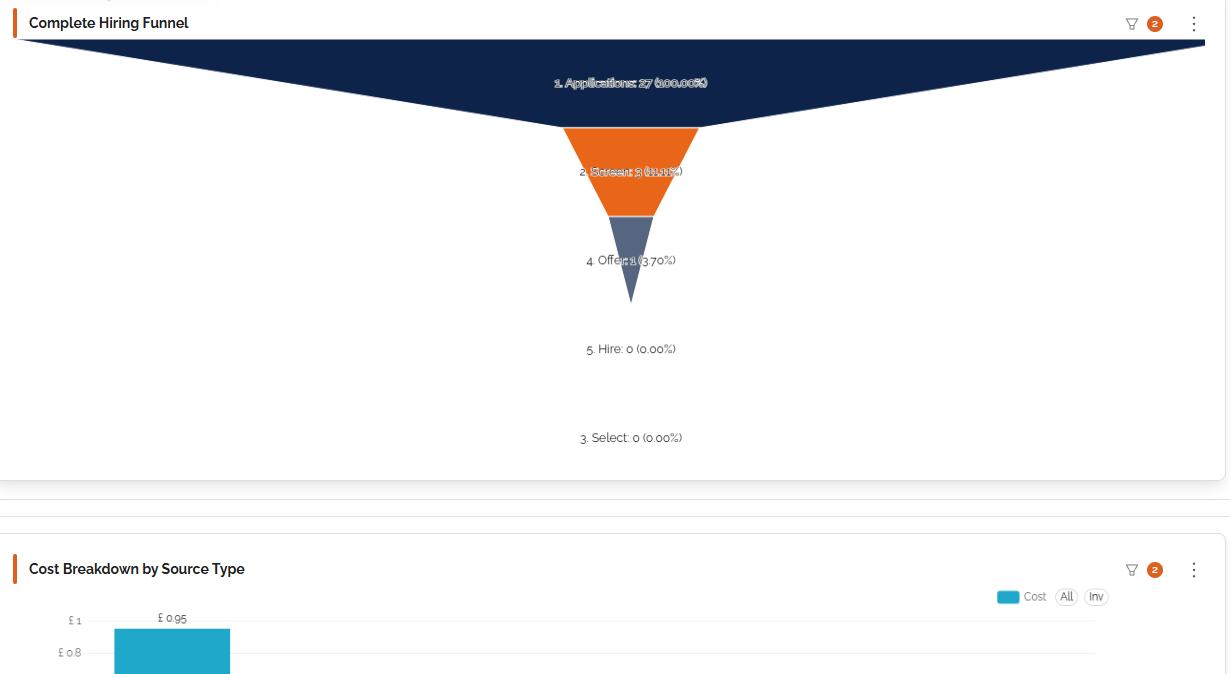
- Complete Hiring Funnel - A visual of how many candidates are in each stage of the hiring workflow.
- Cost Breakdown by Source Type - A cost comparison of each source, such as the Premium channel, Lite channel, etc.
- Cost Distribution - How spending is distributed across sources and departments.
- Acceptance Rate by Department & Source - Highlighting the performance of departments and posting channels.
- Acceptance Rate Trend - Tracking acceptance rates across your chosen time period.
- Hiring Details - Key information recorded about the applicants.

Operational Data
Track data for open and filled jobs in the Operational Data tab. Overview tiles show data for filled positions, open positions, total open jobs, requisitions filled this period, and current open jobs.
Get more details with charts and tables detailing:
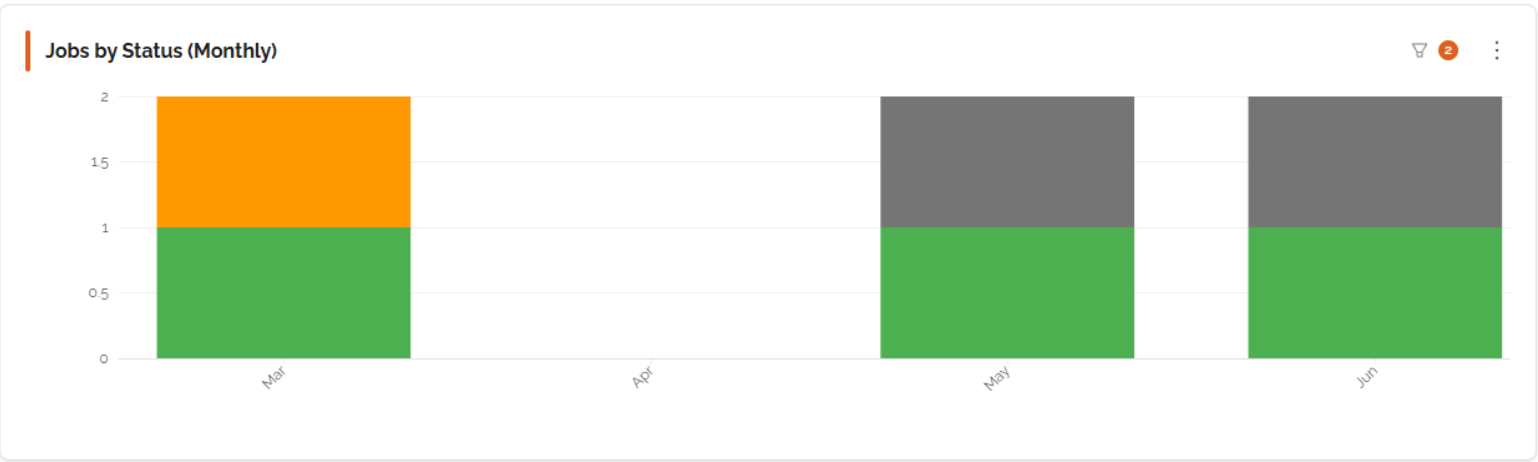
- Jobs by Status (Monthly) - Including open, closed, filled, and unfilled requisitions.
- Jobs Trend Over Time - Tracking the number of requisitions opened over your chosen time period.
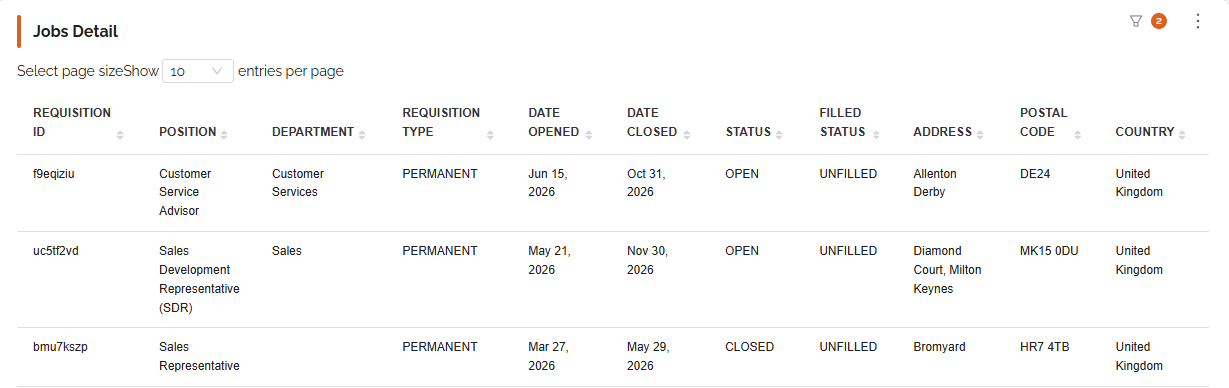
- Jobs Details - Key information associated with the job.

Sources & Channels
The Sources & Channels tab gives you information about candidate sources (such as the premium channel, careers page, etc.), enabling you to see which channel provides the best value for money, application volume, and conversion.
Overview tiles include total active sources, best conversion rate, and average cost per source.
You'll also find detailed graphs and charts showing:
- Application Volume by Source - Comparing the volume of applications for each source, such as your careers page.
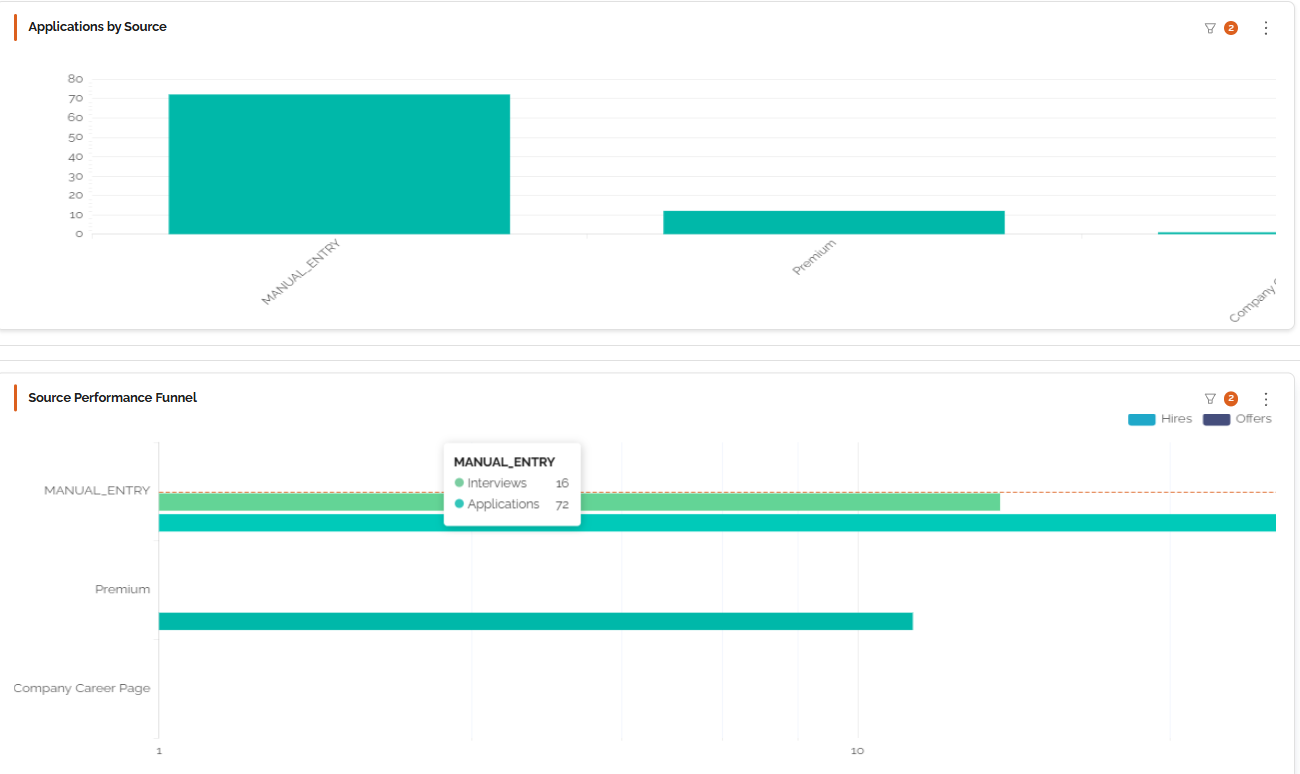
- Applications by Source - Detailing the number of applications captured by each source.
- Source Performance Funnel - Showing the number of candidates in each stage for each source.
- Source Performance Funnel Stage Group Base.
- Source Performance Details - Key performance insights for each source.

Datasets
The Datasets Tab is broken down into two subsections - DE&I and Datasets.
DE&I Dashboard
This section provides valuable DE&I data insights gathered from DE&I forms completed by applicants, while ensuring individual applicant information remains anonymous. You can also switch to the Raw Data tab to view and download all captured information in raw data form.
The section shows graphs detailing the following:
- Form Status - The number of forms sent and completed vs not completed.
- Candidate Pool Diversity - A breakdown of the number of applications in each DE&I answer group in the candidate pool.
- DE&I Breakdown of Offers - A breakdown of the number of applicants in each DE&I answer group who have been offered a role.
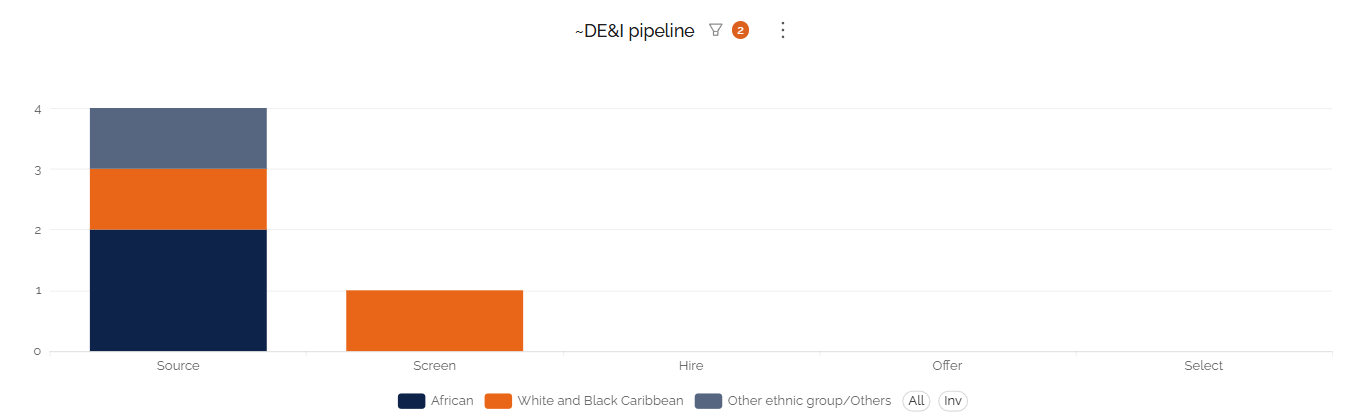
- DE&I Pipeline - A breakdown of the number of applicants in each DE&I answer group at each hiring stage.
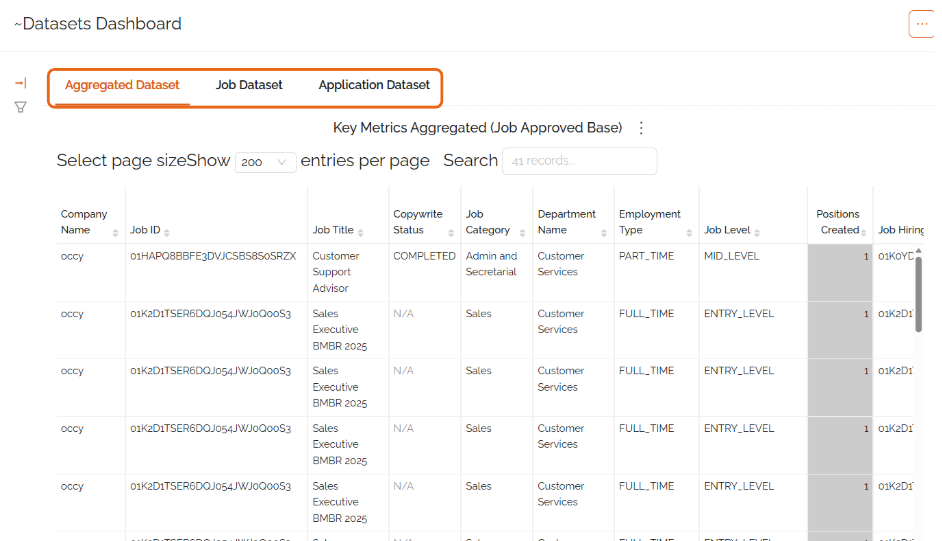
Datasets Dashboard
This section contains all aggregated raw data concerning applicants and jobs within the system which can be downloaded, filtered, and used in a way that best suits you.
Skip between the tabs at the top of the table to view different focuses.

Scheduling Reports
Create and schedule custom reports in your preferred format and have them sent directly to you and other recipients. Easily schedule reports to be sent with the most up-to-date information on a daily, weekly, or monthly basis.
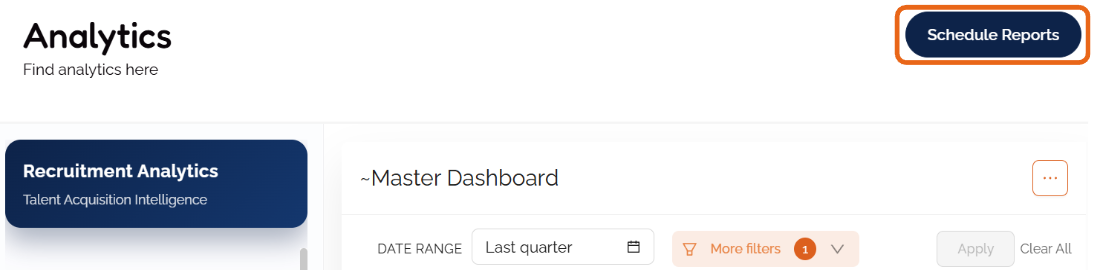
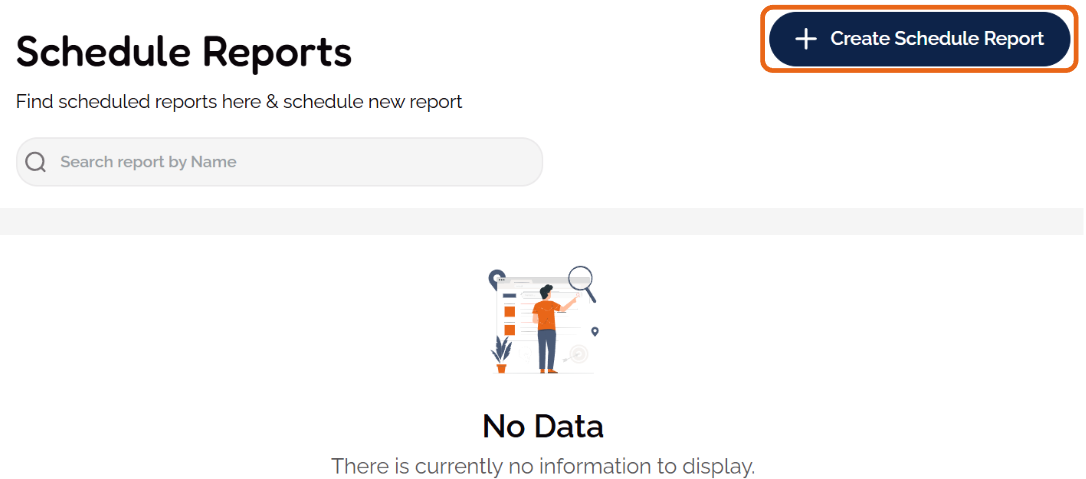
Get started by clicking the Schedule Reports button at the top of the Analytics section.
Next, click Create Schedule Report.
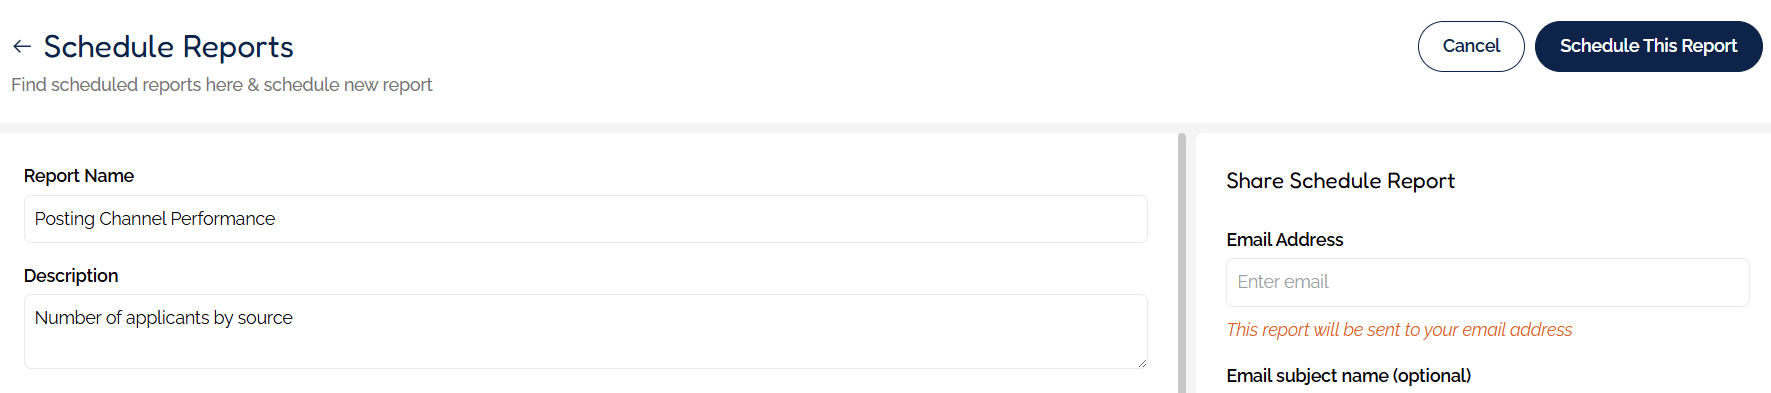
A form will appear. Simply give the report a name and add a description of what you would like the report to contain.
For example, you can keep up to date on posting channel efficiency with 'Number of Applicants per Source'.
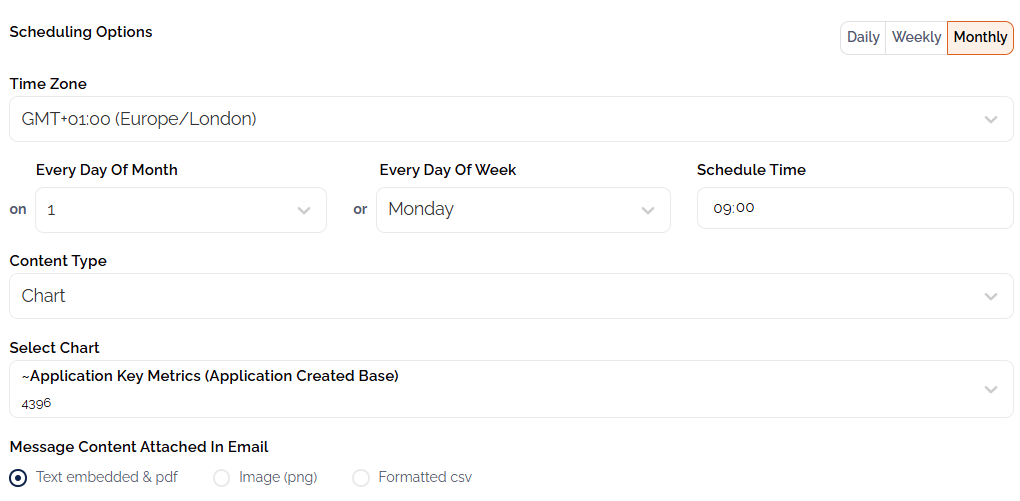
- Next, choose how often you would like the report to be sent - daily, weekly, or monthly. If you select a weekly or monthly report, you will be prompted to choose a date or day of the week that you would like the report to be sent.
- Then choose your time zone and select how often or when you would like the report to be sent and at what time.
- Choose whether you would like the data presented in a chart or dashboard format, then choose from the list of options provided.
- Next, use the Message Content options to choose how the information will be presented in the email.
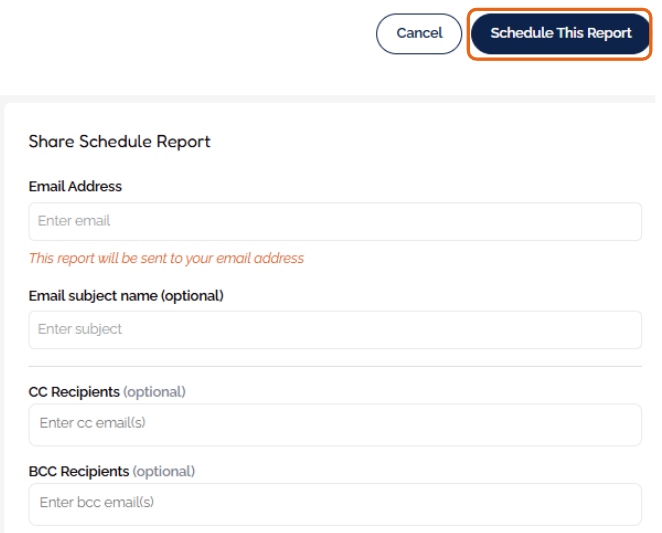
- Finally, provide the email address that you would like the report to go to, along with any other recipients' email addresses.
- Click Schedule This Report to finalise.
Was this article helpful?
That’s Great!
Thank you for your feedback
Sorry! We couldn't be helpful
Thank you for your feedback
Feedback sent
We appreciate your effort and will try to fix the article